IELTS Writing Task 1 | Commuting IELTS Writing Task 1 | Commuting Instructions: The two pie charts above show the reasons for which people go to work by bicycle or by car. Summarize the information by selecting and reporting the main points. You could make comparisons when necessary. LELB Student: Arash The first pie chart demonstrates the reasons why some people prefer to cycle to work. Conversely, the second pie chart illustrates the reasons for those who choose to go to work by car. 30% of commuters who prefer cycling say that this is because riding a bicycle to work is healthier ...
IELTS Writing Task 1 | Commuting to Work
Share This Post
About the Author
Related Posts


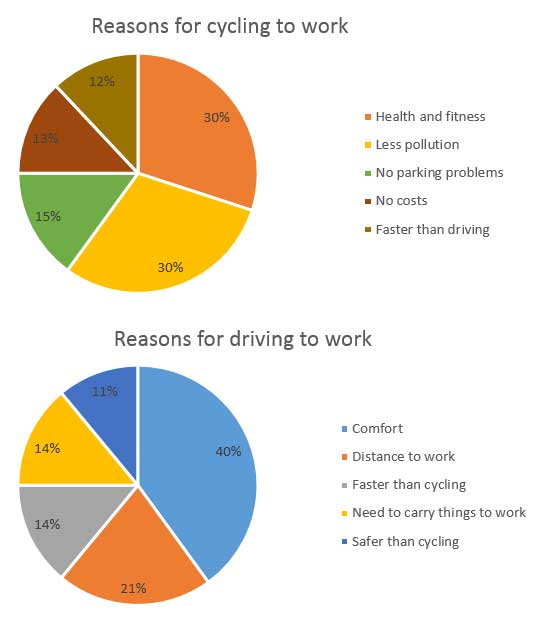
The first pie chart demonstrates the reasons why some people prefer to cycle to work. Conversely, the second pie chart illustrates the reasons for those who choose to go to work by car.
30% of commuters who prefer cycling say that this is because riding a bicycle to work is healthier than driving. The same amount of people, 30% say that they cycle to work because it causes less pollution than driving. In addition, 13% of people them prefer to cycle to work because of its low price in comparison to driving. Surprisingly, a similar amount of people said that they cycled to work because it is faster than traveling by car.
The majority of people who prefer to travel by car say it is more comfortable than cycling. The two least significant reasons for going to work by car, with 14% and 11% sequentially, is that people need to carry things to work and that it is safer than cycling to work.
To conclude, we can obviously see that the majority of people who cycle to work do this for health and environmental reasons. On the other hand, those who travel by car want to have a more comfortable journey.
Dear Arash,
Thank you so much for submitting your IELTS report on commuting to work to us for assessment and scoring.