IELTS Writing Task 1 on transport preferences in 4 different countries among young people. Join LELB Society's students and members and submit your essays and reports to us for complete analysis. Watch this video on IELTS Writing Task 1 on transport preferences https://www.youtube.com/watch?v=BOcY3vuBscA Write a report on transport preferences Write a report of approximately 150 words in 20 minutes on the transport preferences among young people in percentage across 4 different countries. IELTS Writing Task 1 on transport preferences As this chart illustrates, the usage of cars has the highest percentage in all four contraries except for Germany, where the ...
IELTS Writing Task 1 on Transport Preferences in 4 Places
Share This Post
About the Author
Related Posts


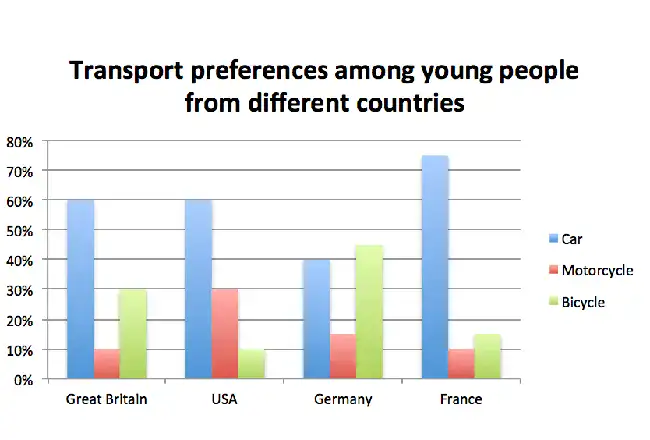
As this chart illustrates, the usage of cars has the highest percentage in all four contraries except for Germany, where the usage of bicycles is higher. Furthermore, it is conspicuous that between all these four countries, cars are the most popular in France with more than 70% preference for transportation among young people. In Great Britain and USA the preference is equivalent with 60% preference and it is 40% in Germany.
In Germany, bicycles are the favorite with almost 45% usage, in the second place we have Great Britain with only less than 30% of youths choosing bicycles to transport. As it is clear, bicycles are not much popular in the two other countries with only less than 15% usage.
Motorcycles do not have that much popularity in these countries except for the USA with 30% preference between young people and in the other three countries it is less than 20%.
We can come to a conclusion from this chart that cars are the most possible choice among young people as transportation and motorcycles are the least favorite ones.
Thank you for submitting your report to us for analysis. This report as your IELTS Writing Task 1 will be evaluated before our next online classes.
Please mention how much time (how many minutes) you’ve spent on generating this report.