IELTS Writing Task 1 Graph on Age of Students + Analysis

IELTS Writing Task 1 Graph on Age of Students with assessment

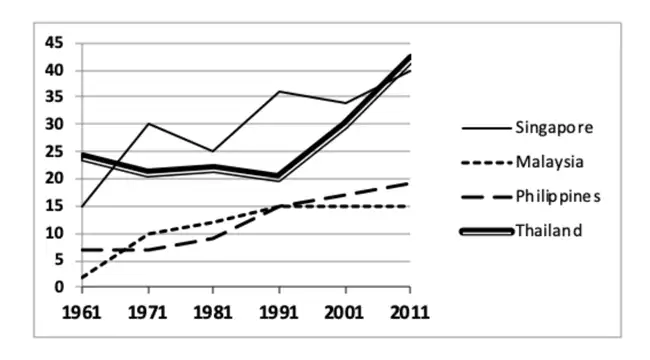
IELTS Writing Task 1 as a graph on the age of students in 4 different countries from 1961 to 2011 with full essay and assessment submitted to us by one of our students. Video of age of students IELTS graph Watch this video on YouTube. Write a report on the age of students The graph…

IELTS Writing Task 1 on Online Sales with Assessment

IELTS Writing Task 1 on online sales with full assessment

IELTS Writing Task 1 on online sales of smartphones, laptops and tablets submitted to us by our students and members. Join LELB Society’s students and send us your IELTS essays and reports for thorough analysis. Watch this video about IELTS Writing Task 1 on online sales Watch this video on YouTube. Write a report on…

IELTS Writing Task 1 Essay on Marine Life as Chart Report

IELTS Writing Task 1 Essay on Marine Life as a report on a bar chart

IELTS Writing Task 1 as an essay on marine life submitted to us for analysis by one of our students. Join LELB Society’s members or students, and send us your IELTS essays and reports for complete assessment. Watch this video about essay on marine life Watch this video on YouTube. Write a report about essay…

IELTS Writing Task 1 on Transport Preferences in 4 Places

IELTS Writing Task 1 on transport preferences in 4 different countries in percentage

IELTS Writing Task 1 on transport preferences in 4 different countries among young people. Join LELB Society’s students and members and submit your essays and reports to us for complete analysis. Watch this video on IELTS Writing Task 1 on transport preferences Watch this video on YouTube. Write a report on transport preferences Write a…

Free IELTS Class on Analyzing Graphs with a Podcast

Free IELTS class on analyzing graph with a podcast for IELTS candidates

Free IELTS Class on Analyzing Graphs Free IELTS Class on Analyzing Graphs Listen to the podcast of this free IELTS class on analyzing graphs: Watch this video on YouTube. Join our free English classes for IELTS and TOEFL on Discord every day.  Join our Discord server where we hold our online classes. You can also chat with hundreds…

Figures in APA Style | Research Conduction

Research Conduction LELB Society

Figures Figures are used to display information discussed in the text in a concise format that is easy to comprehend. They generally consist of graphs, charts, pictures, diagrams, and illustrations. Figures should not be used to duplicate textual information. Rather, they are used as a helpful complement to or amplification of what is expressed verbally…

Tables in APA Style | Research Conduction

Research Conduction LELB Society

Tables in APA Style Tables in APA Tables are used to prepare quantitative data, statistics, and analyses in a format that makes them easy to understand and facilitates comparisons. APA style tables do not contain any vertical lines. Type the table number and then (on the next double-spaced line) type the table number flush left…

How to Give a Significant Presentation

Academic Articles LELB Society

How to Give a Significant Presentation How to Give a Significant Presentation Write the script of your lecture in advance and rehearse your presentation several times before your main speech. This technique gives you an abundance of confidence, especially if you are a beginner. You can also prepare handouts for your presentation and distribute them…

Work Performance – IELTS Writing Task 1

Work Performance – IELTS Writing Task 1 Work Performance – IELTS Writing Task 1 Instruction: The graph above shows factors affecting work performance in various age ranges in a percentile scale. Write a report for a university lecturer describing the information in the graph. You have about 20 minutes to complete the report that includes…

IELTS Writing Task 1: Computer Ownership

IELTS Writing Task 1 on computer ownership written by LELB Society students and submitted to us as a report for analysis and assessment IELTS essay topic on computer ownership The graph above shows computer ownership by the level of education in the years 2002 and 2010. Write a report for a university lecturer describing the…