IELTS Essay on Car Trips | IELTS Writing Task 1
Source: Noun
/sɔːs/ US /sɔːrs/ noun [C] 1. the place something comes from or starts at, or the cause of something: a source of heat/energy/light Oranges are a good source of vitamin C. Money is often a source of tension and disagreements in young married couples.
2. someone or something that supplies information: The journalist refused to reveal her sources (= say who had given the information to her). According to Government sources (= people in the Government) many MPs are worried about this issue. source /sɔːs/ US /sɔːrs/ verb [T often passive] to get something from a particular place: Where possible the produce used in our restaurant is sourced locally.“>Source of Visual Data: Noun
/ˈdeɪ.tə/ US /-ţə/ group noun [U] information, especially facts or numbers, collected for examination and consideration and used to help decision-making, or information in an electronic form that can be stored and processed by a computer: The data was/were collected by various researchers.“>Data: www.ieltsliz.com
Instructions:
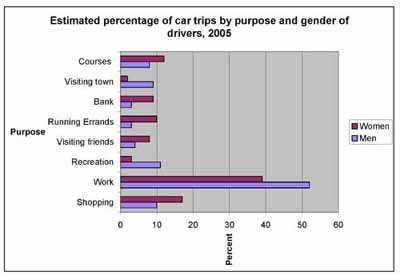
The bar chart below shows the estimated percentage of car trips taken by male and female drivers for a variety of purposes in 2005.
Summarize the information by selecting and reporting the main figures and percentages, and make comparisons where Relevant (adj)
/ˈrel.ə.vənt/ connected to somebody or something logically and in an appropriate manner – related – pertinent – germane: What he’s talking about is by no means relevant to our topic of discussion.“>relevant.
LELB Society’s Student: Mohsen
The bar chart below demonstrates the estimated percentage of car trips happened((taken)) by male drivers and female drivers((male and female drivers)) for a variety of purpose((purposes)) (courses, visiting town, bank, Running Errands((running errands)), visiting friends, recreation, work, shopping((and shopping))).
Overall, female drivers had((took / made)) more car trips (five columns((rows)) of bar chart((the bar chart))) then((than)) male drivers (three columns of bar chart). First of all, both male drivers and female drivers had most percentage car trips((the highest percentage of car trips)) of the work((on the way to work)). Whereas((Nevertheless)), male and female drivers had least percentage car trips((the lowest percentage of car trips)) of((for)) visiting town.
In term of((In terms of)) work men drivers had 52 percent car trips as opposed((as opposed to – It’s better to write: in comparison to)) women drivers had((who had)) 39 percent car trips. after((After — Not a good conjunction here, it’s better to use: moreover)) that, women driver((drivers)) had more car trips on((for)) shopping than men drivers (around 18 percent and10((and 10)) percent respectively). Similarly, women drivers and men drivers((women and men drivers)) of car trips were almost the same((took almost the same percentage of car trips)) on((for)) bank and running errands (about 10 percent and 3 percent respectively). Visiting town and recreation were important((much / far more important)) for men. So men drivers of car trips were considerable increase((considerably higher or more)) than female drivers of car trips. on((On)) the other hand, women drivers of car trips on visiting friends and courses were more than men drivers of car trips.
Examiner’s Notes:
- Visual Data: Noun
/ˈdeɪ.tə/ US /-ţə/
Analysis:
group noun [U]
information, especially facts or numbers, collected for examination and consideration and used to help decision-making, or information in an electronic form that can be stored and processed by a computer:
The data was/were collected by various researchers.“>Data- It is better to add the year of the survey (i.e. 2005) to the end of your introductory paragraph.
- Lexical Resources (18 of 25%)
- Task Achievement (23 of 25%)
- Coherence and Cohesion (17 of 25%)
- You should use more conjunctions.
- Grammatical Range & Accuracy (12 of 25%)
- Word Count: “193” Great!
IELTS Essay on Car Trips
The bar chart below demonstrates the estimated percentage of car trips happened by male drivers and female drivers for a variety of purpose (courses, visiting town, bank, Running Errands, visiting friends, recreation, work, shopping).
Overall, female drivers had more car trips (five columns of bar chart) then male drivers (three columns of bar chart). First of all, both male drivers and female drivers had most percentage car trips of the work. Whereas, male and female drivers had least percentage car trips of visiting town.
In term of work men drivers had 52 percent car trips as opposed women drivers had 39 percent car trips. after that, women driver had more car trips on shopping than men drivers (around 18 percent and10 percent respectively). Similarly, women drivers and men drivers of car trips were almost the same on bank and running errands (about 10 percent and 3 percent respectively). Visiting town and recreation were important for men. So men drivers of car trips were considerable increase than female drivers of car trips. on the other hand, women drivers of car trips on visiting friends and courses were more than men drivers of car trips.
Thank you for submitting your report to us for analysis.