IELTS Writing Task 1 Body Weight IELTS Writing Task 1 Body Weight Instructions Visual Data The graphs above summarize the weight measurements of people living in Charlestown in 1955 and 2015. Summarize the information by selecting and reporting the main features, and make comparisons where relevant. LELB Society’s Student: Sasan The graphs cast light on the percentages of people categorized into four groups according to their weights in Charlestown in 1995 and 2015. Overall, what stands out from the graphs is that in 2015, more people were coping with obesity compared to 1995. Paying attention to the year 1995, people who were ideal in ...
IELTS Writing Task 1 Body Weight and BMI
Share This Post
About the Author
Related Posts


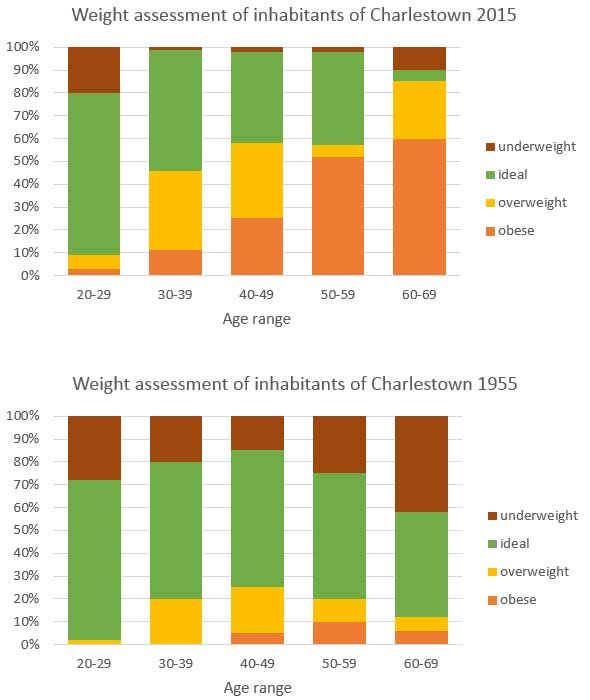
The graphs cast light on the percentages of people categorized into four groups according to their weights in Charlestown in 1995 and 2015.
Overall, what stands out from the graphs is that in 2015, more people were coping with obesity compared to 1995.
Paying attention to the year 1995, people who were ideal in terms of weight constituted more than 50 percent of the population. To be more elaborate, in the 20-29 age bracket, almost 70 percent of people were ideal but it decreased approximately to 50 percent in the 60-69 age group. Moreover, only were the minority of people obese, most of whom were living in the sixth decade of their life. Furthermore, underweight dwellers made up 30 percent of people in the 20-29 age bracket and it fell slightly among middle aged people and rose gradually when it came to the oldest people. Also, making up almost 20 percent of people in the 30-49 age group, overweight people were not tangible among other groups of people.
Turning to the year 2015, the older people were, the more obese they became. In fact, 60 percent of people aged 60-69 years were obese as opposed to the 20-29 age bracket in which the rate of obesity was next to zero. What is more, almost 70 percent of the youngest group were ideal, however it declined to 5 percent among the oldest group. Interestingly, underweight people were mostly included in the two latter groups, making up less than 20 percent of people in their own groups. Last but not least, overweight people had considerable numbers in the 30-49 and 60-69 age group, accounting for, roughly, 20 percent of people in their own groups.
Dear Sasan,
Thank you so much for writing and submitting your IELTS report on body weight and BMI to us for assessment and evaluation.