IELTS Writing Task 1 on online shopping sales for retail sectors in New Zealand in 2003 and 2013. Join LELB Society students and members and send us your IELTS essays and reports for thorough analysis during your monthly membership. Watch this video on IELTS Writing Task 1 on Online Shopping Sales https://www.youtube.com/watch?v=Uo2CdbMhZw4&t=4s Write a report on Online Shopping Sales The pie charts above display the online shopping sales for retail sectors in New Zealand in 2003 and 2013. Summarize the visual information shown in the pie charts by selecting and reporting the main features, and make comparisons when necessary. Source ...
IELTS Writing Task 1 on Online Shopping Sales in 2013
Share This Post
About the Author
Related Posts


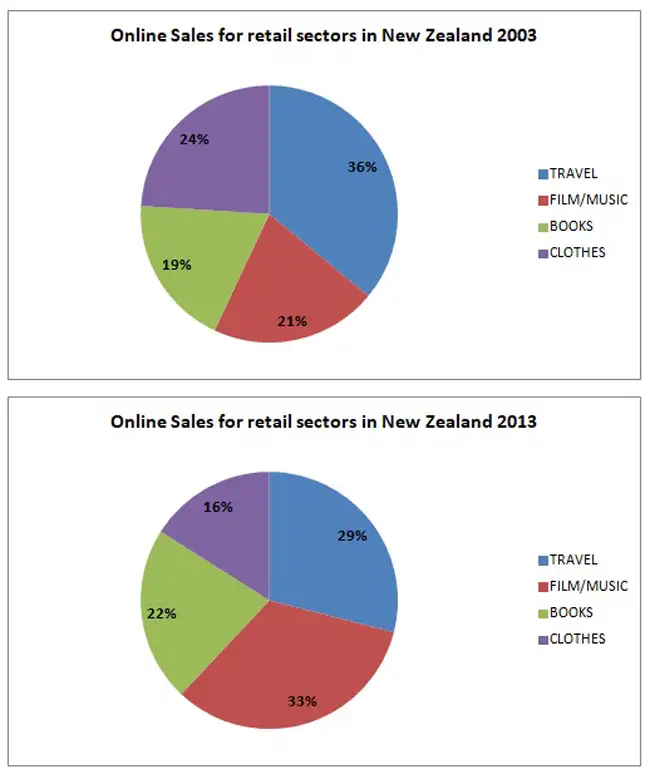
This pie chart portrays the online shopping sales for retail sectors in New Zealand in 2003 and 2013. As it is evident the pie chart is divided into 4 sections, clothes, books, film/music, and travel.
The biggest portion of the online shopping sales in the year 2003 is for travel with 36% and in the year 2013 is for music and film with 33%. On the contrary, books have the lowest rank in the year 2003 with only 19%, and clothes in the year 2013 with 22%. The three percent-elevation of book sales between these 10 years demonstrates that people in New Zealand tend to read more books which is good news. The reduction in clothes percentage_ which was 16% in 2013_ shows that people are less materialistic.
The pie chart also illustrates that people’s passion for music and cinema in New Zealand increased highly between these 10 years with a 12% gap. Moreover, fewer people tend to travel because the portion of travel in 2013 is 29%, which means it had a 7% reduction.
Time spent on writing: 20 minutes.
Thank you for submitting your report to us for analysis. It will be evaluated before the next online class.