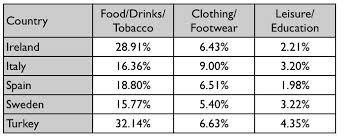
Shopping List IELTS Writing Task 1 Shopping List IELTS Writing Task 1 Visual Data Instructions The table above gives information about consumer spending on three categories of items in five different countries in 2002. Summarize the information by selecting and reporting the main features, and make comparisons where relevant. LELB Society’s Student: Sasan The chart demonstrates the expenditure on foods, drinks, tobacco, clothing, footwear, leisure, and education in five countries, namely Ireland, Italy, Spain, Sweden, and Turkey in 2002. Overall, it can be seen that in all countries, people’s budgets went mostly on foods, drinks, and tobacco, while leisure and education had the ...
Home » IELTS Essay Writing Practice » Shopping List IELTS Writing Task 1

Shopping List IELTS Writing Task 1
Updated: by Dr. Mohammad Hossein Hariri Asl
Time to Read: 2 minutes | 575 Views | 2 Comments on Shopping List IELTS Writing Task 1
Share This Post
About the Author
Dr. Mohammad Hossein Hariri Asl is an English and Persian instructor, educator, researcher, inventor, published author, blogger, SEO expert, website developer, entrepreneur, and the creator of LELB Society. He's got a PhD in TEFL (Teaching English as a Foreign Language).
Number of Posts: 4242


The chart demonstrates the expenditure on foods, drinks, tobacco, clothing, footwear, leisure, and education in five countries, namely Ireland, Italy, Spain, Sweden, and Turkey in 2002.
Overall, it can be seen that in all countries, people’s budgets went mostly on foods, drinks, and tobacco, while leisure and education had the lowest proportion.
Paying attention to the expenditure on foods, drinks, and tobacco, Turkey was ranked first, at 32.14% and next, Irish people spent 28.91% of their money on these products and Swedish people’s expenditure stood at 15.77%. Turning to the spending on clothing and footwear, Italy and Sweden, at 9% and 5.4%, had the most and least amount of spending on these products respectively. Moreover, Irish and Turkey spent almost the same amount of money on clothing and footwear, at nearly 6%. What is more, when it came to leisure and education, Turkey spent the most amount of money, at 4.35%, however Spanish people had the lowest amount of spending on these services.
Dear Sasan,
Thank you so much for submitting your IELTS report on shopping list to us for assessment and evaluation.