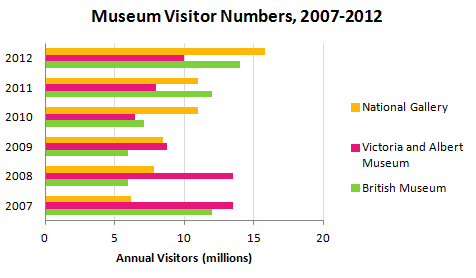
IELTS Writing Task 1 on visiting museums written by LELB Society students in preparation for the IELTS exam Instruction The graph above shows the number of times museums have been visited. Write a report for a university lecturer describing the information in the graph. You have about 20 minutes to complete the report that includes at least 150 words. Essayist: Taraneh, LELB Society's Student This graph compares the number of visitors who visited National Gallery, Victoria and Albert Museum and British Museum between the years 2007 and 2012. The visitors who visited the National Gallery rose gradually from years 2007 ...
Home » IELTS Essay Writing Practice » IELTS Writing Task 1: Visiting Museums

IELTS Writing Task 1: Visiting Museums
Updated: by Dr. Mohammad Hossein Hariri Asl
Time to Read: 2 minutes | 378 Views | 1 Comment on IELTS Writing Task 1: Visiting Museums
Share This Post
About the Author
Dr. Mohammad Hossein Hariri Asl is an English and Persian instructor, educator, researcher, inventor, published author, blogger, SEO expert, website developer, entrepreneur, and the creator of LELB Society. He's got a PhD in TEFL (Teaching English as a Foreign Language).
Number of Posts: 4242


Thank you so much for submitting your IELTS report to us for analysis and assessment. Here are some points apart from the feedback that was provided in the class:
1. on the year = in the year
2. it has attracted so many attentions = it has attracted so much attention