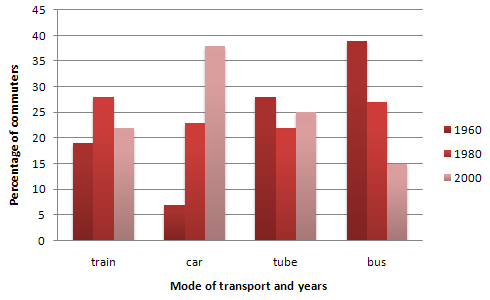
IELTS Writing Task 1 on mode of transport written by LELB Society students and submitted to us for analysis and assessment IELTS topic on mode of transport Instruction: The graph above shows different modes of transport used by commuters between the years 1960 and 2000. Write a report for a university lecturer describing the information in the graph. You have about 20 minutes to complete the report that includes at least 150 words. Essayist: Taraneh This graph indicates the usage of train, bus, tube and car in the years 1960, 1980 and 2000. The train usage in 1960 was about ...
Home » IELTS Essay Writing Practice » IELTS Writing Task 1: Mode of Transport

IELTS Writing Task 1: Mode of Transport
Updated: by Dr. Mohammad Hossein Hariri Asl
Time to Read: 2 minutes | 381 Views | No Comments on IELTS Writing Task 1: Mode of Transport
Share This Post
About the Author
Dr. Mohammad Hossein Hariri Asl is an English and Persian instructor, educator, researcher, inventor, published author, blogger, SEO expert, website developer, entrepreneur, and the creator of LELB Society. He's got a PhD in TEFL (Teaching English as a Foreign Language).
Number of Posts: 4242


