Log in

IELTS Essay on Native Languages Based on Pie Charts

Published on February 4th, 2020 | Last updated on May 29th, 2023 by | Category: IELTS Essay Writing Practice | No Comments on IELTS Essay on Native Languages Based on Pie Charts | 115 Views | Reading Time: 3 minutes

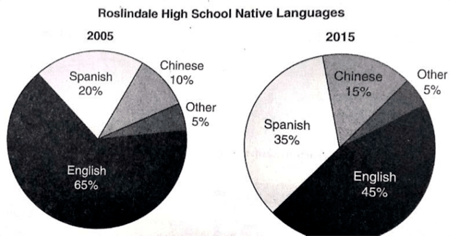
IELTS Essay on native Languages

IELTS Essay on Native Languages

Task 1

Read and respond to the following tasks. You should spend about 20 minutes on each task.

The charts above show the native languages spoken by students at Roslindale High School in two different years.

Summarize the information by selecting and reporting the main features, and make comparisons when relevant.

Write at least 150 words.

Source of visual data: submitted by the IELTS candidate

IELTS Candidate: A student in our Discord server

The chart shows what native languages were spoken the most by students at Roslindala High school in 2005 and 2015.

The most native language spoken by students in 2015 in Roslindala was English, which was 65%. Where the other 20% of the spoken language was Spanish, and the 10% Chinese. Though the other 5% were other languages. On 2015, the leveling of the spoken languages was changed while the sequence of the ranking of the spoken languages stayed the same. As an example, in both years 2005 and 2015, English was the top language spoken by the students of Roslindala. But in 2015, because of increase of Spanish language by 35%, the English language was deceased by 25% which becomes 45%. As well the Chinese language increased up to 15%, while the rest of the 5% remained as it was on 2005 with other languages.

  • at Rosindale
  • 65%, whereas / while – Use a subordinating conjunction to show contrast.
  • This conjunction “though” should not be used in a simple independent sentence.
  • In 2015
  • an increase in
  • in 2005

The chart basically describes the differences how the changes occurred I Roslindalaa within 10 years of the students speaking the most native language at high school.

Assessment

  • Band score = 6 of 9
  •  Analysis:
    • You could compare the statistics more accurately.
    • You should use more quantifiers, e.g. slightly, significantly, noticeably, and so forth.
  • Cohesion and Cohesion (18% of 25%)
  • Grammatical Range and Accuracy (16% of 25%)
  • Lexical Resources (14% of 25%)
  • Task Achievement (16% of 25%)
    • You have not specified the comparative trends in the percentages of the languages over a decade.
    • Your conclusion is technically another form of your introduction. In your conclusion, you should specify the changes and trends over the decade.
  • Spelling: Good
  • Punctuation: Average
  • Word Count: “171” Excellent!

Leave a Comment

thirteen − 10 =