Log in

IELTS Essay on School Attendance with Correction

Published on February 17th, 2020 | Last updated on February 5th, 2021 by | Category: IELTS Essay Writing Practice | No Comments on IELTS Essay on School Attendance with Correction | 66 Views | Reading Time: 4 minutes

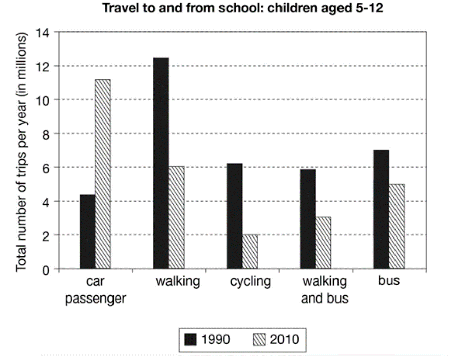
IELTS Essay on school attendance

IELTS Essay on school attendance

Task 1

Read and respond to the following task. You should spend about 20 minutes on this task. Write at least 150 words.

The graph above shows the total number of trips and different types of transport systems used to go to school by students in 1990 and 2010.

Summarize the information by selecting and reporting the main features, and make comparisons when relevant.

Source of visual data: submitted by the IELTS candidate

IELTS Candidate: A student in our Discord server

This chart shows the number of trips made by children in one country in 1990 and 2010 traveling from or to school with different transports.

  • Transport is uncountable. You can say: transport systems.

Children traveling from this school are basically between the age of 2-10 and a lot of students travel per year, in millions. As the graph shows, in 1990 about 12 million 5 hundred thousand students preferred traveling by walking which was the most used transport in 1990. Whereas about 4 million and 5hundred thousand preferred car passengers. Looking at the other hand, in 2010 the most transport used by students for traveling was car passenger. Though the least transport used by the students in 2010 was cycling.

  • between the age of 2-10? – Wrong manifestation of the given data!
  • in 1990, – Use a comma.
  • 12.5 million students
  • Whereas is a subordinating conjunction, and it cannot be used in an independent or main clause.
  • 4.5 million students
  • were car passengers / were car travelers / traveled by car
  • On the other hand,
  • in 2010, – Use a comma.
  • was cars
  • Though, like whereas, cannot be used in an independent sentence.

The chart is basically comparing and contrasting on what transport the students between the age of 5-12 used the most and the least from and to school in 1990 and 2010 in the total number of trips per year in millions.

  • “On” should be omitted.
  • Your conclusion sounds like an overview of the graph. You’ve not made any conclusion or comparison.

Assessment

  • Band score = 5.5 of 9
  •  Analysis:
    • You could compare the statistics more accurately.
    • You should use more quantifiers, e.g. slightly, significantly, noticeably, and so forth.
  • Cohesion and Cohesion (16% of 25%)
  • Grammatical Range and Accuracy (15% of 25%)
  • Lexical Resources (16% of 25%)
  • Task Achievement (13% of 25%)
    • You have not specified the comparative trends in the proportions of the transport systems.
    • Your conclusion is technically another form of your introduction. In your conclusion, you should specify the changes and trends between the two given years.
  • Spelling: Good
  • Punctuation: Below average
  • Word Count: “153” Good!

Leave a Comment

5 − two =