IELTS Writing Task 1 | Immigration Issues IELTS Writing Task 1 | Immigration Issues Instructions The table, graph or bar chart above shows the emigration rate from the UK to other 5 countries from 2004 to 2007. Write a report for a university lecturer describing the information delineated in the graph. General Information You have 20 minutes for this task. Your essay should consist of at least 150 words. The IELTS Writing Task 1 is an information transfer task, which requires you to write an accurate account of some information presented in graphic form, for example, a graph, table, or ...
IELTS Writing Task 1 | Immigration Issues
Share This Post
About the Author
Related Posts


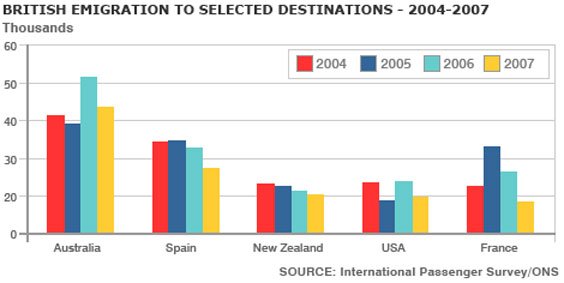
The bar chart above demonstrates the emigration rate from the United Kingdom to other 5 countries from 2004 to 2007. There has generally been a small decrease in the number of immigrants during this period, except Australia and France which had a significant growth from 2004 to 2006. The bar chart also shows that Australia and Spain have far more immigrants in comparison to other countries.
In 2006, Spain had approximately 32 thousand immigrants from the UK. The only country with a greater number of immigrants at the same time was Australia, with around 51 thousands immigrants. Both countries saw a decrease in the number of immigrants in 2007. In New Zealand, the figure fell slightly over the four years, from 24 thousand in 2004 and 20 thousand in 2007.
It is clear that the number of immigrants in the USA fluctuates wildly during this period. The general trend, therefore, was that the proportion of immigrants had a considerable reduction from 2006 to 2007.
Thank you so much for submitting your IELTS essay on immigration issues to us for analysis and scoring.