IELTS Writing Task 1 Public Library

IELTS Writing Task 1 Public Library LELB Society

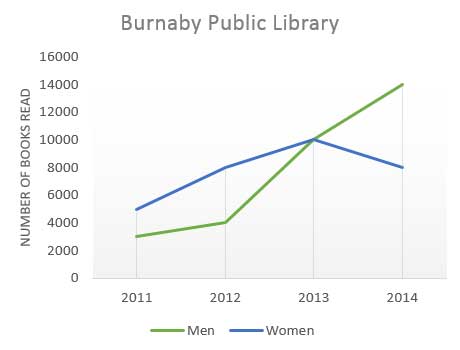
IELTS Writing Task 1 Public Library IELTS Writing Task 1 Public Library Instructions Visual Data The graph above shows the number of books read by men and women at Burnaby Public Library from 2011 to 2014. Write a summary of the information given in the graph by selecting and reporting the main points. You could make comparisons when…

IELTS Writing Task 1 Air Travel in New York

IELTS Writing Task 1 Air Travel LELB Society

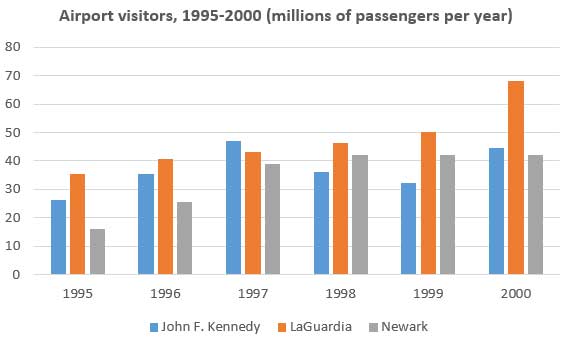
IELTS Writing Task 1 Air Travel IELTS Writing Task 1 Air Travel Instructions Visual data The chart above shows the number of air travelers using three international airports in New York City between 1995 and 2000. Write a summary of the information given in the chart by selecting and reporting the main points. You could make comparisons…

IELTS Writing Task 1 | Pollution Levels

IELTS Writing Task 1 Air Pollution Levels LELB Society

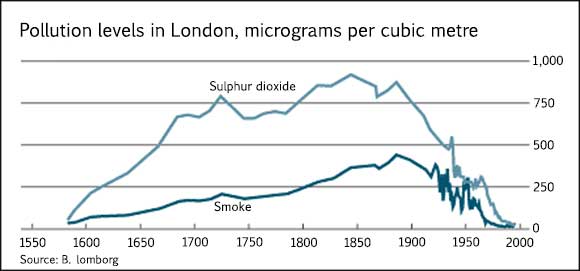
IELTS Writing Task 1 | Pollution Levels IELTS Writing Task 1 | Pollution Levels Instructions: The graph above shows the pollution levels in London between 1600 and 2000. prospect in 2025. Outline the information shown in the graph by selecting and reporting the main features. You can also make comparisons if necessary. LELB Student: Sasan The given…

IELTS Writing Task 1 | Population Growth

IELTS writing task 1 - population growth in india LELB Society

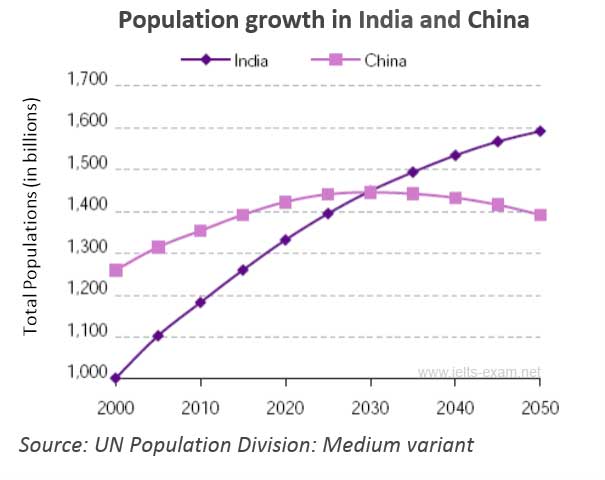
IELTS Writing Task 1 | Population Growth IELTS Writing Task 1 | Population Growth Instructions: The table, graph or bar chart below shows population figures for India and China since the year 2000 and predicted population growth up until 2050. Write a report for a university lecturer describing the information delineated in the graph. Intensifiers…

IELTS Writing Task 1 | Leisure Time

IELTS Writing Task 1 | Leisure Time LELB Society

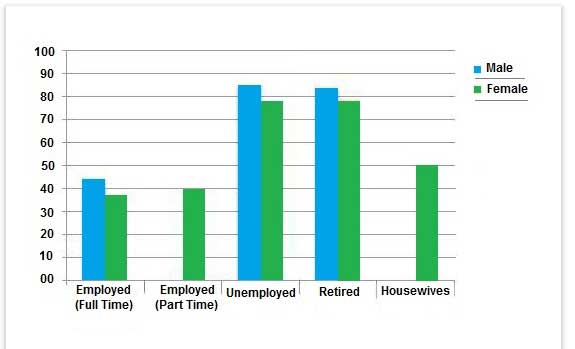
IELTS Writing Task 1 | Leisure Time IELTS Writing Task 1 | Leisure Time ?Instructions: The table, graph or bar chart below shows the number of hours of leisure time during a week enjoyed by males and females across various employment status. Write a report for a university lecturer describing the information delineated in the…

IELTS Writing Task 1 | Immigration Issues

IELTS Writing Task 1 | Immigration Issues

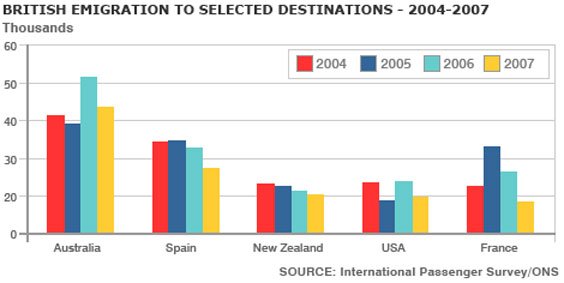
IELTS Writing Task 1 | Immigration Issues IELTS Writing Task 1 | Immigration Issues Instructions The table, graph or bar chart above shows the emigration rate from the UK to other 5 countries from 2004 to 2007. Write a report for a university lecturer describing the information delineated in the graph. General Information You have…

Figures in APA Style | Research Conduction

Research Conduction LELB Society

Figures Figures are used to display information discussed in the text in a concise format that is easy to comprehend. They generally consist of graphs, charts, pictures, diagrams, and illustrations. Figures should not be used to duplicate textual information. Rather, they are used as a helpful complement to or amplification of what is expressed verbally…

Tables in APA Style | Research Conduction

Research Conduction LELB Society

Tables in APA Style Tables in APA Tables are used to prepare quantitative data, statistics, and analyses in a format that makes them easy to understand and facilitates comparisons. APA style tables do not contain any vertical lines. Type the table number and then (on the next double-spaced line) type the table number flush left…

How to Give a Significant Presentation

Academic Articles LELB Society

How to Give a Significant Presentation How to Give a Significant Presentation Write the script of your lecture in advance and rehearse your presentation several times before your main speech. This technique gives you an abundance of confidence, especially if you are a beginner. You can also prepare handouts for your presentation and distribute them…

Work Performance – IELTS Writing Task 1

Work Performance – IELTS Writing Task 1 Work Performance – IELTS Writing Task 1 Instruction: The graph above shows factors affecting work performance in various age ranges in a percentile scale. Write a report for a university lecturer describing the information in the graph. You have about 20 minutes to complete the report that includes…