English Vocabulary about Numbers with Flashcards

تفاوت خواندن اعداد در زبان آلمانی و زبان فارسی با انیمیشن

English Vocabulary about Numbers with Flashcards English Vocabulary about Numbers with Flashcards A few Watch this video on YouTube I have to buy a few things at the supermarket. A lot of She eats a lot of vegetables.  There are a lot of people at the party. Accumulate As people accumulate more wealth, they tend to spend a greater…

IELTS Writing Task 1 Tips and Lessons

IELTS Writing Task 1 LELB Society

The IELTS Writing Task 1 can often seem daunting, but with a few strategic tips, you can navigate this task with confidence and achieve a high score. This part of the exam requires you to describe, summarize, or explain information presented in a graph, table, chart, or diagram. Here are some practical tips to help…

IELTS Writing Task 1 | Export Performance

IELTS Writing Task 1 | Export Performance LELB Society

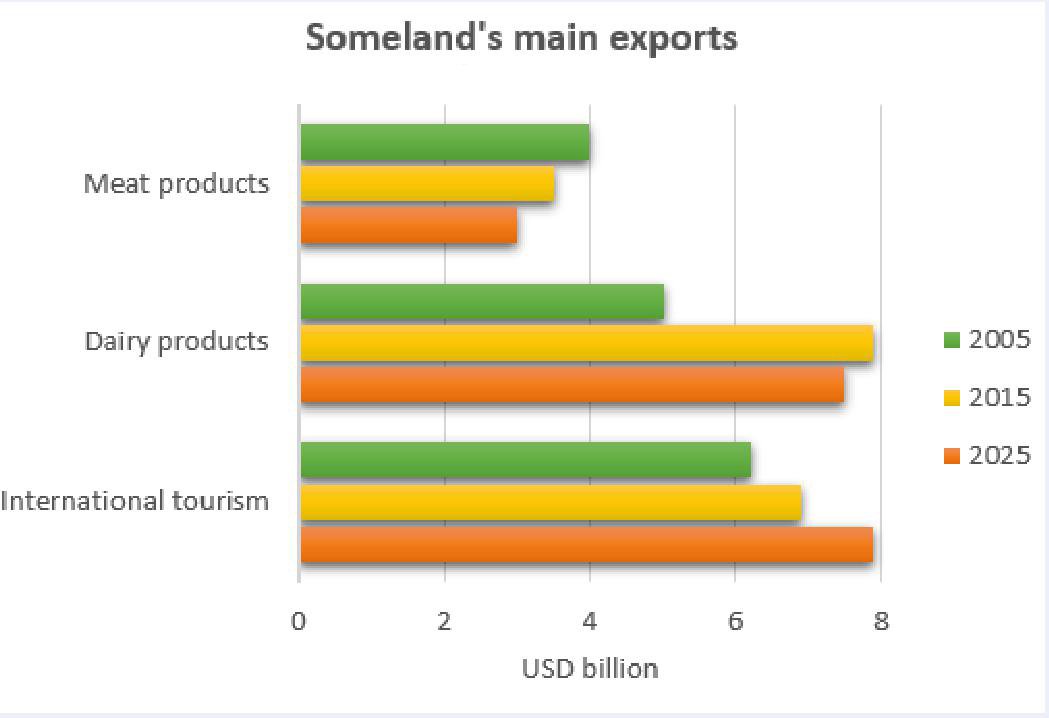
IELTS Writing Task 1 | Export Performance IELTS Writing Task 1 | Export Performance ?Instructions: The chart below gives some information about Someland’s main export performances in 2005, 2015, and its future prospect in 2025. Write a report for a university lecturer describing the information delineated in the graph. Essayist: Arash The bar chart below…

IELTS Writing Task 1 | Population Growth

IELTS writing task 1 - population growth in india LELB Society

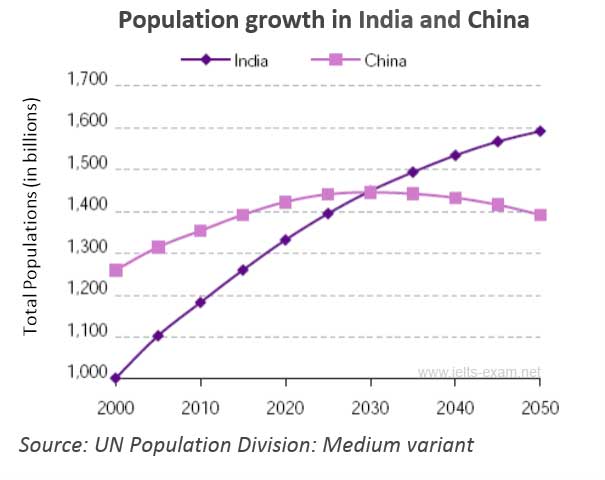
IELTS Writing Task 1 | Population Growth IELTS Writing Task 1 | Population Growth Instructions: The table, graph or bar chart below shows population figures for India and China since the year 2000 and predicted population growth up until 2050. Write a report for a university lecturer describing the information delineated in the graph. Intensifiers…

IELTS Writing Task 1 | Leisure Time

IELTS Writing Task 1 | Leisure Time LELB Society

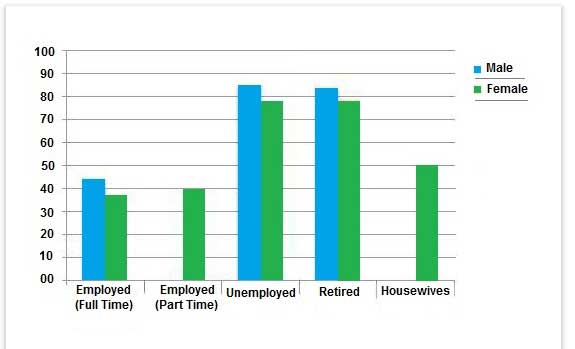
IELTS Writing Task 1 | Leisure Time IELTS Writing Task 1 | Leisure Time ?Instructions: The table, graph or bar chart below shows the number of hours of leisure time during a week enjoyed by males and females across various employment status. Write a report for a university lecturer describing the information delineated in the…

IELTS Writing Task 1 | Immigration Issues

IELTS Writing Task 1 | Immigration Issues

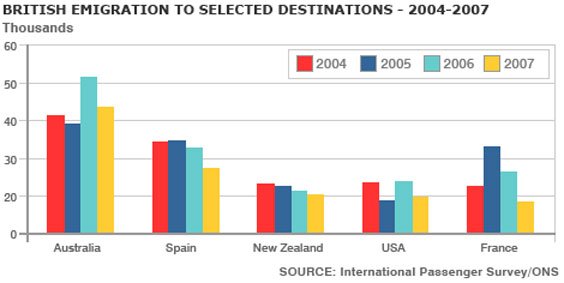
IELTS Writing Task 1 | Immigration Issues IELTS Writing Task 1 | Immigration Issues Instructions The table, graph or bar chart above shows the emigration rate from the UK to other 5 countries from 2004 to 2007. Write a report for a university lecturer describing the information delineated in the graph. General Information You have…

Tables in APA Style | Research Conduction

Research Conduction LELB Society

Tables in APA Style Tables in APA Tables are used to prepare quantitative data, statistics, and analyses in a format that makes them easy to understand and facilitates comparisons. APA style tables do not contain any vertical lines. Type the table number and then (on the next double-spaced line) type the table number flush left…

Results Section | Research Conduction

Research Conduction LELB Society

Results Results Section Start chapter 4 with restatement of the problem Use past tense to record what you found. The results are a straightforward description of your statistical or qualitative analyses and findings. In this stage, you should not elaborate on findings. Later on, (in Discussion section), you can go into the details. In Results…

IELTS Writing Task 1: Mode of Transport

IELTS Writing Task 1 on mode of transport written by LELB Society students and submitted to us for analysis and assessment IELTS topic on mode of transport Instruction: The graph above shows different modes of transport used by commuters between the years 1960 and 2000. Write a report for a university lecturer describing the information…

IELTS Writing Task 1: Visiting Museums

IELTS Writing Task 1 on visiting museums written by LELB Society students in preparation for the IELTS exam Instruction The graph above shows the number of times museums have been visited. Write a report for a university lecturer describing the information in the graph. You have about 20 minutes to complete the report that includes…