Energy Production IELTS Writing Task 1 Energy Production IELTS Writing Task 1 Instructions The pie charts above show the comparison of various types of energy production in France in two years. Write a report that compares the different portions of energy production displayed in the two pie charts. LELB Society’s Student: Sasan The charts demonstrate the amount of energy produced by various materials in France in 1995 and 2005. Generally, in 2005, the amounts of all materials increased for producing energy except for petro. In details, 29.8% of energy was produced by coal in 1995, however it rose to 30.93% in 2005. ...
Energy Production IELTS Writing Task 1
Share This Post
About the Author
Related Posts


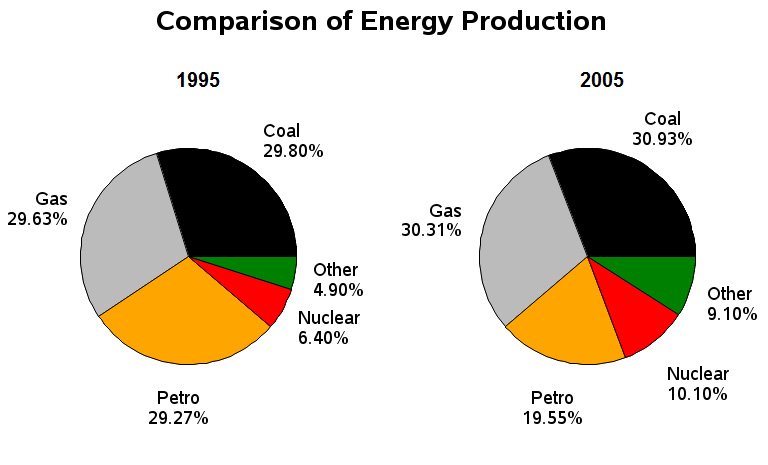
The charts demonstrate the amount of energy produced by various materials in France in 1995 and 2005. Generally, in 2005, the amounts of all materials increased for producing energy except for petro.
In details, 29.8% of energy was produced by coal in 1995, however it rose to 30.93% in 2005. Also, there was the same trend in using nuclear energy at 6.4% and 10.1% in 1995 and 2005 in turn. Moreover, the usage of gas increased as well, from 29.63% in 1995 to 30.31% in 2005. Furthermore, petro which was one of the main resources, experienced a decline from 29.27% to 19.55%. Finally, in 1995, 4.9% of energy was originated from other resources and it increased to 9.1% in 2005.
Dear Sasan,
Thank you so much for submitting your IELTS essay on energy production to us for assessment and evaluation.