IELTS Writing Task 1 | Pollution Levels IELTS Writing Task 1 | Pollution Levels Instructions: The graph above shows the pollution levels in London between 1600 and 2000. prospect in 2025. Outline the information shown in the graph by selecting and reporting the main features. You can also make comparisons if necessary. LELB Student: Sasan The given graph demonstrates how the densities of Sulphur dioxide and smoke changed in London from 1600 to 2000. Overall, the densities of these gases were on the rise til 1870 approximately, but they dwindled in the rest of the time span. Elaborating on the details, in ...
Home » IELTS Essay Writing Practice » IELTS Writing Task 1 | Pollution Levels

IELTS Writing Task 1 | Pollution Levels
Updated: by Dr. Mohammad Hossein Hariri Asl
Time to Read: 3 minutes | 324 Views | 6 Comments on IELTS Writing Task 1 | Pollution Levels
Share This Post
About the Author
Dr. Mohammad Hossein Hariri Asl is an English and Persian instructor, educator, researcher, inventor, published author, blogger, SEO expert, website developer, entrepreneur, and the creator of LELB Society. He's got a PhD in TEFL (Teaching English as a Foreign Language).
Number of Posts: 4242


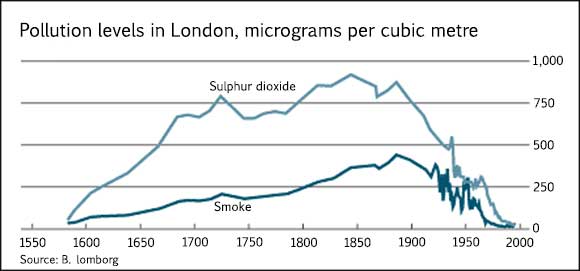
The given graph demonstrates how the densities of Sulphur dioxide and smoke changed in London from 1600 to 2000. Overall, the densities of these gases were on the rise til 1870 approximately, but they dwindled in the rest of the time span.
Elaborating on the details, in 1600, the density of Sulphur dioxide was about 250 micro grams per cubic meter, whereas that of smoke was almost 50 micro grams per cubic meter. Moreover, with the passage of time, the aforementioned densities rose gradually and the difference between the densities of these two materials grew until 1970 at which they hit their pinnacles, reaching 900 and 400 micro grams per cubic meter respectively. It should be noted that the density changes of Sulphur dioxide was more unstable compared to that of smoke in this period of time. Afterwards, they both plummeted turbulently and reached zero roughly, in 2000.
Thanks a lot for assuming this responsibility.
In our next session, we will seek a solution to some unexpected problems like this.
line 1: The verb changed should be used in passive form : were changed
line 9; Was should be replaced by were because the subject is plural (density changes)
thank you
Dear Karim,
I’m so glad to see you are using this feature. Please keep on doing that.
About your first point, “change” is a both transitive and intransitive verb. So, it’s not necessary to use it in a passive voice.
About your second point, you are absolutely right. ✅ Thank you so much for your attention. ?
You’re welcome. Your explanations about writing are very helpful and comprehensive.Thank you so much.
Anytime, dear Karim. It’s all my pleasure.