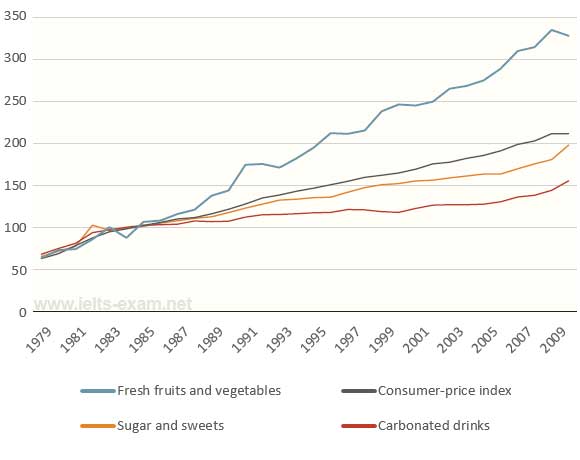
IELTS Writing Task 1 Price Changes IELTS Writing Task 1 Price Changes ?Instructions: Visual data was adopted from https://www.ielts-exam.net/ The line graph above shows some relative price changes for fresh fruits and vegetables, sugars and sweets, and carbonated drinks among urban consumers in the United States between 1978 and 2009. Summarize the information by selecting and reporting the main features, and make comparisons where relevant. LELB Society’s Student: Sasan The line graph demonstrates how the prices of some products namely, fresh fruits and vegetables, Carbonated drinks and sugar and sweets changed in the United States from 1978 to 2009 and also the ...
Home » IELTS Essay Writing Practice » IELTS Writing Task 1 Price Changes

IELTS Writing Task 1 Price Changes
Updated: by Dr. Mohammad Hossein Hariri Asl
Time to Read: 3 minutes | 382 Views | 2 Comments on IELTS Writing Task 1 Price Changes
Share This Post
About the Author
Dr. Mohammad Hossein Hariri Asl is an English and Persian instructor, educator, researcher, inventor, published author, blogger, SEO expert, website developer, entrepreneur, and the creator of LELB Society. He's got a PhD in TEFL (Teaching English as a Foreign Language).
Number of Posts: 4242


The line graph demonstrates how the prices of some products namely, Fresh fruits and vegetables, Carbonated drinks and sugar and sweets changed in the United States from 1978 to 2009 and also the trend for CPI (Consumer Price Index) has been clarified.
It can be seen the prices of all products experienced increases during this time span per capita. To be more elaborate, in 1979, the prices of all products were almost the same, standing at 70 approximately. The prices rose moderately with the same speed until 1981. Afterwards, all the prices perpetuated rising but the price of sugar and sweets overtook that of other products and commenced decreasing in 1982 and ultimately all the prices reached 100, in 1983. In the rest of this period, on average, all the prices grew with various speeds and as a result, in 2009, the prices of Fresh fruits and vegetables, Sugar and sweets and carbonated drinks ranked first, second and third respectively. In addition, the increases of all prices were almost smooth except for the price of Fresh fruits and vegetables which witnessed some fluctuations. Last but not least, CPI which elucidates the average changes of all products was increasing during this period of time.
Dear Sasan,
Thank you so much for submitting your IELTS report on price changes to us for assessment and evaluation.