IELTS Writing Task 1 on Migration Reasons on a Pie Chart

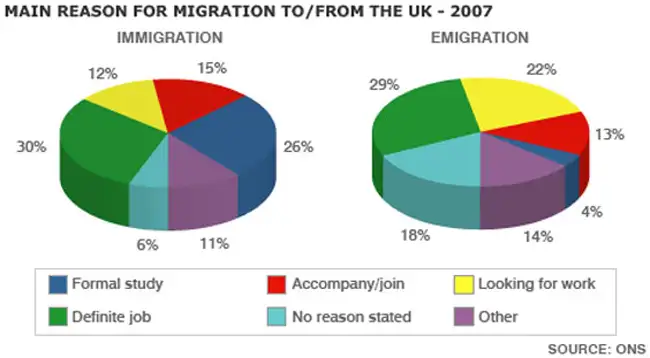
IELTS Writing Task 1 on migration reasons to / from the UK in 2007 based on a pie chart

IELTS Writing Task 1 on migration reasons to / from the UK based on a pie chart submitted to us by one of our students. Join our students and send us your IELTS essays and reports for complete analysis. Video of IELTS Writing Task 1 on migration reasons Watch this video on YouTube Write a…

IELTS Writing Task 1 on Online Shopping Sales in 2013

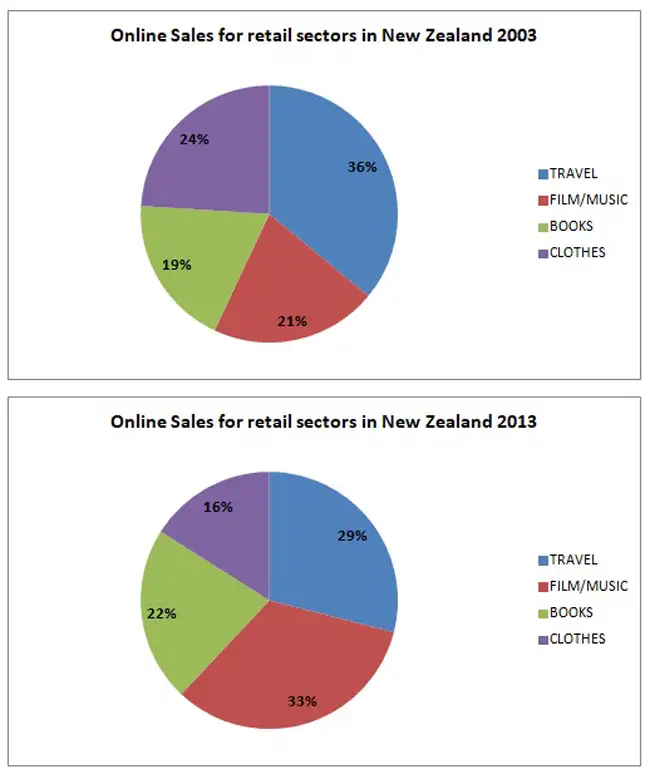
IELTS Writing Task 1 on online shopping sales in New Zealand from retail sectors in 2003 and 2013

IELTS Writing Task 1 on online shopping sales for retail sectors in New Zealand in 2003 and 2013. Join LELB Society students and members and send us your IELTS essays and reports for thorough analysis during your monthly membership. Watch this video on IELTS Writing Task 1 on Online Shopping Sales Watch this video on…

IELTS Essay on Native Languages Based on Pie Charts

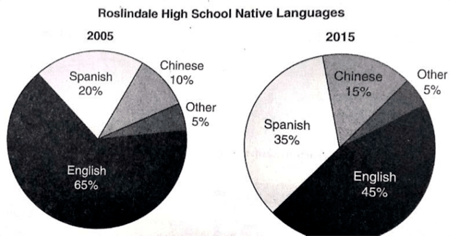
IELTS Essay on native Languages based on a pie chart for comparison

IELTS Essay on native Languages IELTS Essay on Native Languages Task 1 Read and respond to the following tasks. You should spend about 20 minutes on each task. The charts above show the native languages spoken by students at Roslindale High School in two different years. Summarize the information by selecting and reporting the main…

Energy Production IELTS Writing Task 1

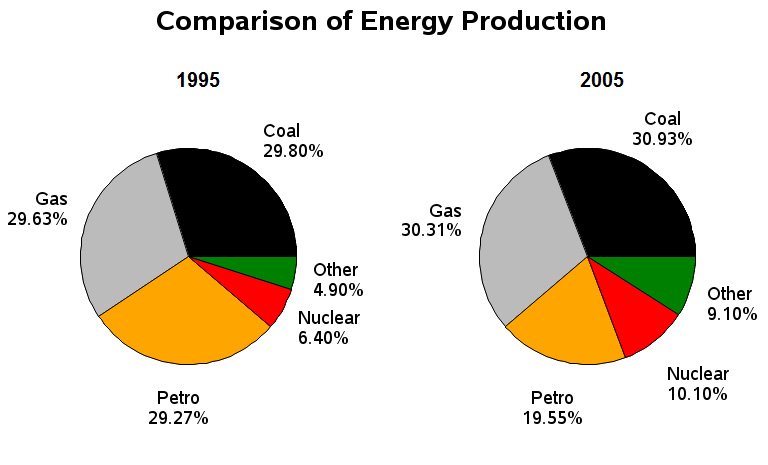
Energy Production IELTS Writing Task 1 LELB Society

Energy Production IELTS Writing Task 1 Energy Production IELTS Writing Task 1 Instructions The pie charts above show the comparison of various types of energy production in France in two years. Write a report that compares the different portions of energy production displayed in the two pie charts. LELB Society’s Student: Sasan The charts demonstrate the amount…

IELTS Writing Task 1 Tips and Lessons

IELTS Writing Task 1 LELB Society

The IELTS Writing Task 1 can often seem daunting, but with a few strategic tips, you can navigate this task with confidence and achieve a high score. This part of the exam requires you to describe, summarize, or explain information presented in a graph, table, chart, or diagram. Here are some practical tips to help…

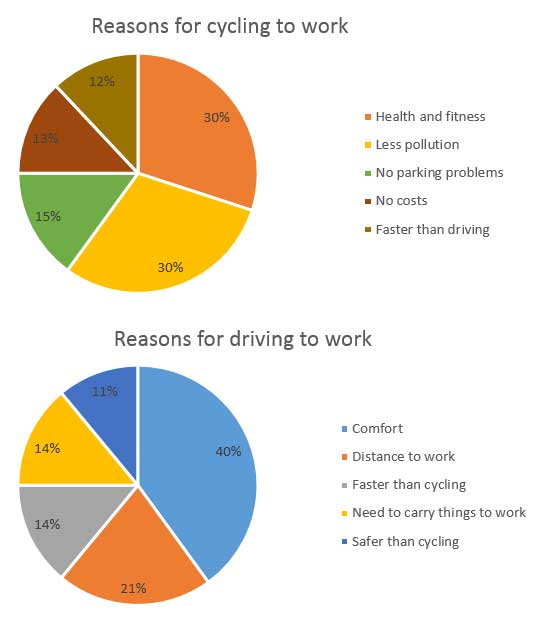
IELTS Writing Task 1 | Commuting to Work

IELTS Writing Task 1 - Commuting to Work LELB Society

IELTS Writing Task 1 | Commuting IELTS Writing Task 1 | Commuting Instructions: The two pie charts above show the reasons for which people go to work by bicycle or by car.  Summarize the information by selecting and reporting the main points. You could make comparisons when necessary. LELB Student: Arash The first pie chart demonstrates the…

Figures in APA Style | Research Conduction

Research Conduction LELB Society

Figures Figures are used to display information discussed in the text in a concise format that is easy to comprehend. They generally consist of graphs, charts, pictures, diagrams, and illustrations. Figures should not be used to duplicate textual information. Rather, they are used as a helpful complement to or amplification of what is expressed verbally…

Results Section | Research Conduction

Research Conduction LELB Society

Results Results Section Start chapter 4 with restatement of the problem Use past tense to record what you found. The results are a straightforward description of your statistical or qualitative analyses and findings. In this stage, you should not elaborate on findings. Later on, (in Discussion section), you can go into the details. In Results…